How can your critical data stand out in the report?
June 28, 2010 1 Comment
We have too much information today! Every day, we prepare reports; summarize data into information. Our reports can contain hundred to thousand records even they are summarized. On the other end, our consumers may receive ten, twenty, or even up to hundred reports a day. We have to make sure the critical data stand out in our reports; otherwise, they may not be noticed. Conditional formatting is a popular feature to easily identify records that require attention.
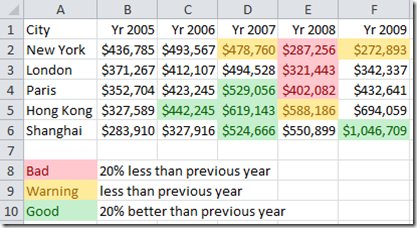
Below is a very simple Excel sales report; it only has 25 records. But even with just 25 records, it may not be so obvious where we should start looking.
But if we highlight the records with colors, then most people would now focus on those highlighted records; especially the red one.
We can format the cells with color in earlier versions of Excel; but it may take a lot of efforts. With conditional formatting, we can highlight the report in a few mouse clicks and Excel would do the rest for us.
- Select the range of cells that you want to apply Conditional Format.
- Click Conditional Formatting in the Home ribbon.
- Select Highlight Cells Rules.
- Select Greater Than…
- Greater Than dialogue would be showed.
- Enter “=B2” in the first box.
- Select “Yellow Fill with Dark Yellow Text” in the second box.
- Click OK button.
All the cells in the range C2..F6 would be formatted according to this condition. I created 2 more conditional formats and you can see them all in the Conditional Formatting Rules Manager.
Conditional Formatting allow us to select a lot of conditions.
- We can highlight the top 5 and bottom 5 records.
- Add databars to each record.
- Color the whole range.
- And even icons.
The above demo was done using Excel 2010 but conditional formatting was introduced in Excel 2003.
Conditional formatting gives us a long list of tools to visualize the data and make sure our consumer would not miss any critical data.
Andrew Chan is the owner and founder of ALG Inc.
We help you to make better and faster decisions!


Pingback: How much time have I spent on blogging? « Technologies and your business